Last Updated: 2019-12-12
Interactive Canvas allows the developers to incorporate a web app in an Action for Google Assistant.
This is awesome, since now developer are not limited by a standard set of interfaces anymore, they can define their own content in a new, more engaging and interactive way!
This tutorial is about using Interactive Canvas API to make an Interactive Canvas Action to draw graphs using your voice.
What you'll build
In this codelab, you are going to implement an Interactive Canvas Action. Your project will:
- Recognize if the user wants to add a node or an edge.
- Use Interactive Canvas to show a web app
- Push commands and parameters to the web app using HTMLResponse
- Receive commands from the web app
What you'll learn
- How to develop intents
- How to develop entities
- How to use Interactive Canvas to interact with the web app
- How to use Interactive Canvas API to enable interaction from the web app
- How to use Cytoscape.js to add nodes and edges to a canvas
Code blocks are glossed over and are provided for you to simply copy and paste.
What you'll need
- Chrome Web Browser
- A Google Account
Get the code
We've put everything you need for this project into a Git repo. To get started, you'll need to grab the code and open it in your favorite dev environment. For this codelab, we recommend using Git.
Strongly Recommended: Use Git
Using Git is the recommended method for working through this codelab.
- Open a new browser tab and go to https://git-scm.com/.
- Download and install Git.
- Open the console.
- Git clone https://github.com/antigones/GraphInteractiveCanvas.git.
Alternative: Download code
Install Firebase CLI
The Firebase CLI allows you to both deploy your Actions project to Cloud Functions and host your web app.
Note: To install the CLI you need to have installed npm,which typically comes with Node.js.
To install or upgrade the CLI, run the following npm command:
npm -g install firebase-tools
To verify that the CLI has been installed correctly, open a terminal and run the following command:
firebase --version
Make sure the version of the Firebase CLI is above 3.5.0 so that it has all the latest features required for Cloud Functions. If not, run npm install -g firebase-tools to upgrade the CLI, as shown above.
To log into Firebase, run the following command:
firebase login
When you log in to Firebase, make sure that you use the same Google account that you will use to create your Actions project.
Make sure to select Spark plan for Firebase
You will develop a small Action for Assistant embedding a web application which uses cytoscape.js to compose graph using your voice.
Cytoscape.js is a javascript library which allows developers to easily manage graphs, offering methods to add or remove nodes and edges and some basic functions to calculate some graphs metrics.
Create AoG project and Dialogflow agent
Next, you'll need to set up an Actions on Google project and configure a Dialogflow agent for this tutorial. To create your Actions on Google project, follow these steps:
- Open the Actions console with Chrome. If you're not already signed in, sign in with the same Google account you used to log into Firebase.
- Click New project.
- Type in a name for your project. This name is for your own internal reference; later on, you can set an external name for your project.
- Click Create project.
- Click the Games & fun card.
- Click the Conversational card.
- Click Deploy in the top navigation.
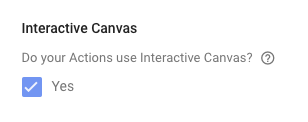
- At the bottom of the page, check the Yes option under Do your Actions use Interactive Canvas?
- At the top of the page, click Save.
To set up your Dialogflow agent and associate it with your Actions on Google project, follow these steps:
- Click Overview in the top navigation.
- Click the drop-down arrow next to Build your Action. Then, click Add Action(s).
- Click Add your first action.
- Under Built-in intents, select Play game and click Get started in Dialogflow.
- On the page titled Create an Agent, enter a name for your agent.
- Click Create Agent.
- A page loads with the text Your Dialogflow agent has been created. On this page, click Go To Agent.
- Click the gear icon in the left navigation (Note: ignore the warning about not saving)
- Click Export and Import.
- Click Restore From Zip.
- Upload the GraphInteractiveCanvasAgent.zip file from the root directory.
- Type "RESTORE" and click Restore.
- Click Done.
The web app will uses cytoscape.js to draw the graph.
Cytoscape.js is a javascript library which allows developers to easily manage graphs, offering methods to add or remove nodes and edges and some basic functions to calculate some graphs metrics.
The web app is made up of three files:
- index.html contains the interface for the web app. This file loads the Interactive Canvas JavaScript library (enabling communication between your web app and your conversational Action) and two other files: action.js and main.js.
- main.js defines the object to interact with and instantiate a new "Action" object.
- action.js registers the callbacks for the interaction with Assistant Action.
index.html
<!doctype html>
<html lang="en">

<head>
        <meta name="viewport" content="width=device-width, user-scalable=no, initial-scale=1, maximum-scale=1">
        <meta charset="UTF-8" />
        <title>Graph with Interactive Canvas</title>
        <script src="https://cdnjs.cloudflare.com/ajax/libs/cytoscape/3.5.1/cytoscape.min.js"></script>
        <script src="https://unpkg.com/webcola/WebCola/cola.min.js"></script>
        <script src="https://cdn.jsdelivr.net/npm/cytoscape-cola@2.3.0/cytoscape-cola.min.js"></script>
        <link href="https://fonts.googleapis.com/css?family=Lobster" rel="stylesheet">
        <link href="https://fonts.googleapis.com/css?family=Cabin" rel="stylesheet">

          <!-- Disable favicon requests -->
          <link rel="shortcut icon" type="image/x-icon" href="data:image/x-icon;,">

          <!-- Load Assistant Interactive Canvas API -->
          <script type="text/javascript" src="https://www.gstatic.com/assistant/interactivecanvas/api/interactive_canvas.min.js"></script>

          <style type="text/css">
                        body {
                                font-family: 'Cabin', cursive;
                        }

                        h1 {
                                font-family: 'Lobster', cursive;
                        }

                        #cy {
                                width: 95%;
                                height: 95%;
                                position: absolute;
                                left: 0;
                                top: 0;
                                z-index: 999;
                        }

                        h1 {
                                opacity: 0.5;
                                font-size: 1em;
                        }
          </style>
</head>

<body>
        <div id="cy">
        </div>
        <script type="text/javascript" src="./action.js"></script>
         <script type="text/javascript" src="./main.js"></script>
</body>
</html>
main.js
window.onload = () => {
        var cy = cytoscape({
        container: document.getElementById('cy'), // container to render in
        layout: {
                name: 'cola'
                },
                style: [
                        {
                                selector: 'node',
                                css: {
                                        'background-color': '#f92411',
                                         'label': 'data(label)'
                                }
                        },
                        {
                                selector: 'edge',
                                css: {
                                        'line-color': '#f92411',
                                        'label': 'data(label)'
                                        }
                        }
                        ],
        });
        this.cy = cy;
        this.action = new Action(this);
            // Call setCallbacks to register assistant action callbacks.
            this.action.setCallbacks();
          window.focus();
};
action.js
class Action {

        constructor(graphContext) {
                this.canvas = window.interactiveCanvas;
                const that = this;
                this.graphContext = graphContext;
                this.commands = {
                        ADDOBJECT: function(data) {
                                that.addNode(data.label);
                        },
                        ADDEDGE: function(data) {
                                that.addEdge(data.from, data.to, data.label);
                        },
                        DEFAULT: function() {
                                // do nothing, when no command is found
                        },
                };
        }

  /**
   * Register all callbacks used by Google Assistant Action
   * executed during creation time.
   */
  setCallbacks() {

    const that = this;
    // declare assistant canvas action callbacks
    const callbacks = {
            onUpdate(data) {
                    that.commands[data.command ? data.command.toUpperCase() : 'DEFAULT'](data);
            },
    };
    // called by the Interactive Canvas web app once web app has loaded to
    // register callbacks
    this.canvas.ready(callbacks);
  }

  addNode(label) {
          this.graphContext.cy.add({
                  group: 'nodes',
                  data: { id:label, label: label, weight: 10}
          });
        this.graphContext.cy.fit();
        this.canvas.sendTextQuery(`Node added`);
  }

   addEdge(from, to, label) {
           this.graphContext.cy.add({
                   group: 'edges', data: { id: from+"_"+to, source: from, target: to, label: label }
           });
           this.canvas.sendTextQuery(`Edge added`);
   }
}
You can deploy the app on any hosting (Github too!). In this codelab we will deploy the web app to Firebase Hosting:
To deploy just type:
firebase deploy
To test the Action, click on the test link, in the right part of the DialogFlow Console:
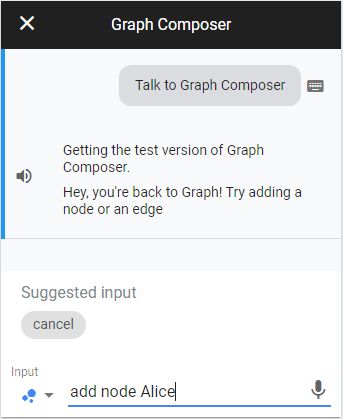
And select "Talk to <Action Name>" to begin the test.
When you are prompted for command, type "add node Alice":
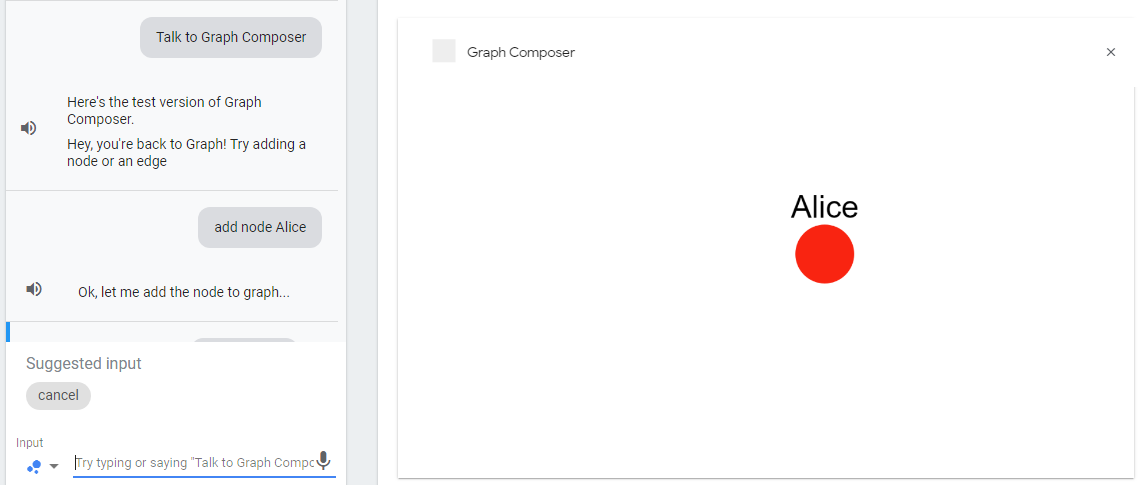
Pressing "Enter" you will see the node on the display!
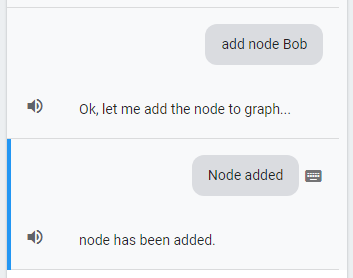
Now type "add node Bob":
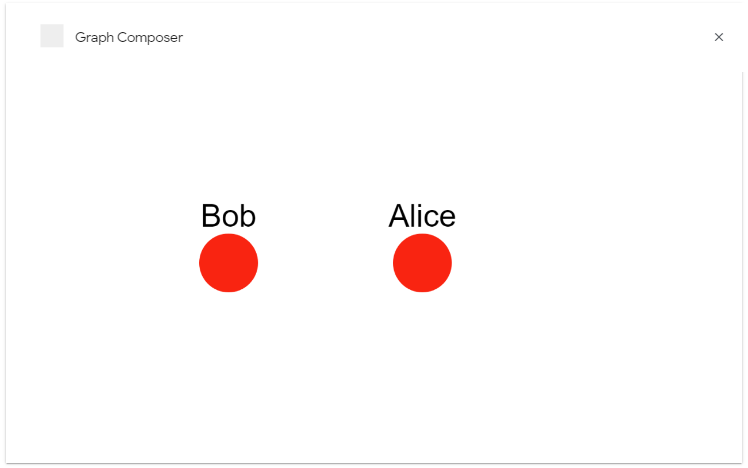
The node is added to the interface:
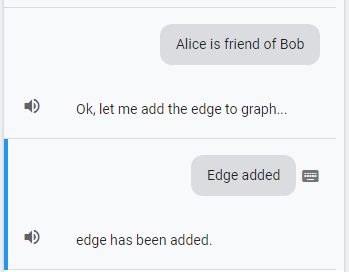
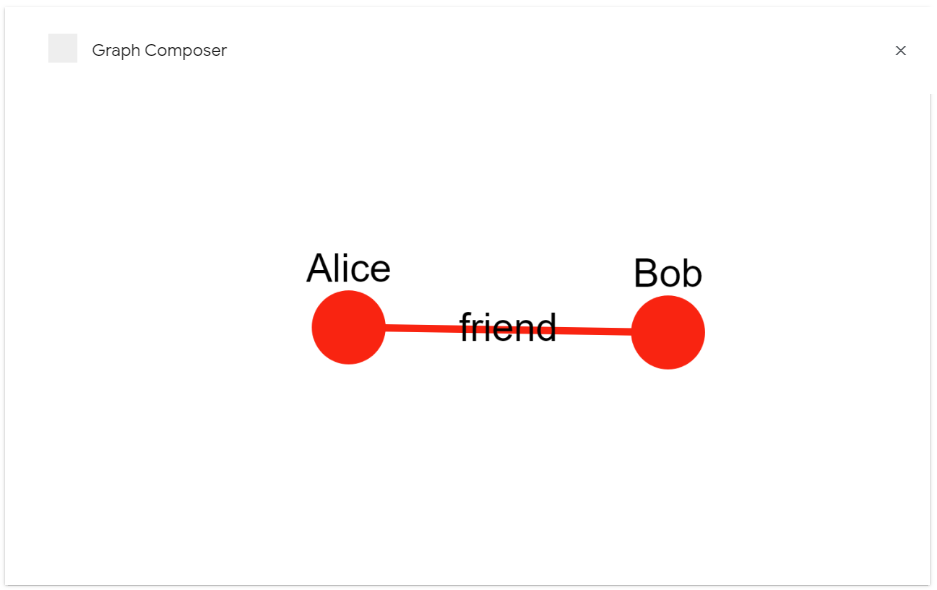
If you type: "Alice is friend of Bob"...an edge is added!
Congratulations, you've successfully built your first Action with Interactive Canvas!
You created the Interactive Canvas Action, developed the web app and tested the Action in the emulator.
You now know the key steps required to develop an Interactive Canvas Action.